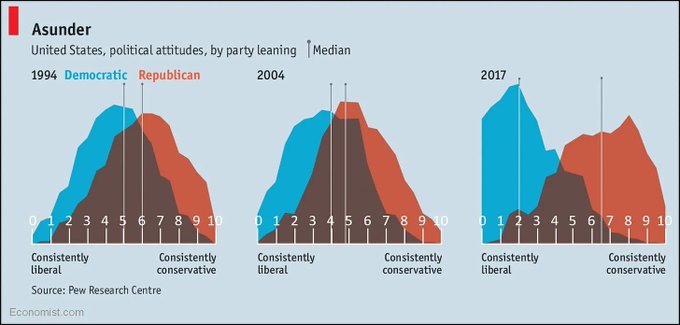
Interesting chart from a couple of academics looking at the change in political polarization over the years. Pretty much matches what we see, the GOP is moving slightly left while the DFL moves significantly further left.
https://x.com/wil_d a_beast630/status/1833262618536227107?s=51&t=cLq01Oy84YkmYPZ-URIMYw
2 comments:
This diagram confuses me. So the last figure shows conservatives becoming more conservative?
I think that the interpretation is that it shows democrats moving leftward to the extreme, and significant numbers of conservatives moving left. The last figure seems to show the conservatives widening instead of peaking. I suspect that it shows the desire of conservatives to be "liked" by popular culture and adjusting their positions to the left in an attempt to achieve that.
Post a Comment